Dynamics 365 Customization: Operations, Security, and Optimization Playbook (2025)
Introduction
Dynamics 365 is Microsoft's suite of intelligent business applications that unify CRM and ERP capabilities. From Sales and Customer Service to Finance and Supply Chain Management, Dynamics 365 helps organizations digitally transform operations, drive customer engagement, and make data-driven decisions powered by AI and analytics.

This operations playbook provides the day-2 guidance you need to run Dynamics 365 Customization in production successfully. We cover monitoring strategies, security hardening, performance optimization, incident response procedures, and cost management — everything required to maintain a healthy, secure, and efficient Dynamics 365 Customization deployment.
Series Context: This is Part 3, completing the Dynamics 365 Customization specialized series. Part 1 covered architecture patterns, and Part 2 provided the implementation walkthrough.
Operational Readiness Checklist
Before declaring production-ready, verify every item:
| Category | Requirement | Priority |
|---|---|---|
| Monitoring | Metrics collection and dashboards configured | P0 |
| Monitoring | Critical alerts with on-call routing established | P0 |
| Security | Vulnerability scanning automated and reviewed | P0 |
| Security | Access reviews scheduled quarterly | P1 |
| Backup | Automated backups with verified restore process | P0 |
| Backup | Disaster recovery plan tested within last 90 days | P1 |
| Performance | Baseline metrics established and documented | P1 |
| Performance | Load testing completed for 2x expected traffic | P1 |
| Compliance | Audit logging enabled with required retention | P0 |
| Documentation | Runbooks created for top 10 operational scenarios | P1 |
Monitoring and Observability
Metrics Strategy
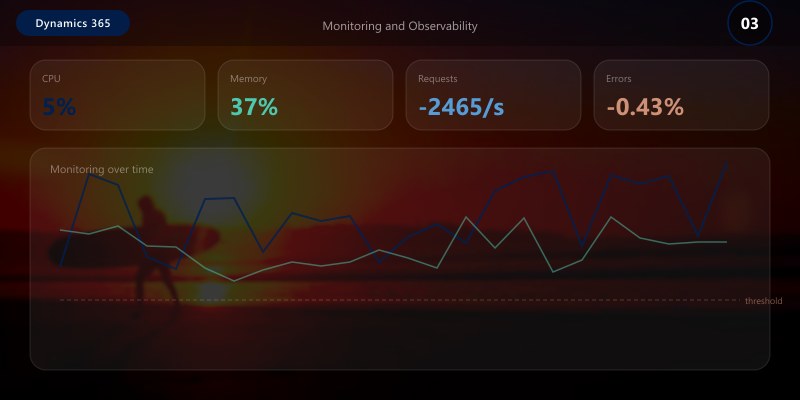
Effective monitoring follows the USE method (Utilization, Saturation, Errors) and RED method (Rate, Errors, Duration):
{
  "monitoring_strategy": {
    "infrastructure_metrics": {
      "cpu_utilization": {
        "warning_threshold": "70%",
        "critical_threshold": "90%",
        "action": "auto-scale at warning, page on-call at critical"
      },
      "memory_utilization": {
        "warning_threshold": "80%",
        "critical_threshold": "95%",
        "action": "investigate at warning, restart service at critical"
      },
      "disk_utilization": {
        "warning_threshold": "75%",
        "critical_threshold": "90%",
        "action": "cleanup and expand at warning, emergency expansion at critical"
      }
    },
    "application_metrics": {
      "request_rate": "requests/sec trending with anomaly detection",
      "error_rate": "alert when >1% of requests fail over 5-minute window",
      "p50_latency": "baseline comparison for gradual degradation",
      "p99_latency": "alert when >500ms sustained for 3+ minutes"
    },
    "business_metrics": {
      "active_users": "daily/weekly/monthly active user counts",
      "feature_adoption": "usage rates for key features",
      "data_growth": "storage consumption trends"
    }
  }
}
Dashboard Design
Create three tiers of dashboards for different audiences:
- Executive Dashboard: High-level health, SLA compliance, cost trends, user adoption
- Operational Dashboard: Service health, error rates, latency percentiles, infrastructure utilization
- Debug Dashboard: Detailed traces, query performance, dependency maps, log aggregation
Alert Configuration
# Alert rules configuration
alerts:
  - name: "Service Availability"
    query: "availability_percentage < 99.9"
    window: "5m"
    severity: critical
    notification:
      - channel: pagerduty
        escalation: immediate
      - channel: teams
        webhook: ops-critical

  - name: "Error Rate Spike"
    query: "error_rate > baseline * 3"
    window: "5m"
    severity: warning
    notification:
      - channel: teams
        webhook: ops-warnings
      - channel: email
        group: platform-team

  - name: "Latency Degradation"
    query: "p99_latency > 500ms"
    window: "10m"
    severity: warning
    notification:
      - channel: teams
        webhook: ops-warnings

  - name: "Cost Anomaly"
    query: "daily_cost > forecast * 1.3"
    window: "24h"
    severity: info
    notification:
      - channel: email
        group: finops-team
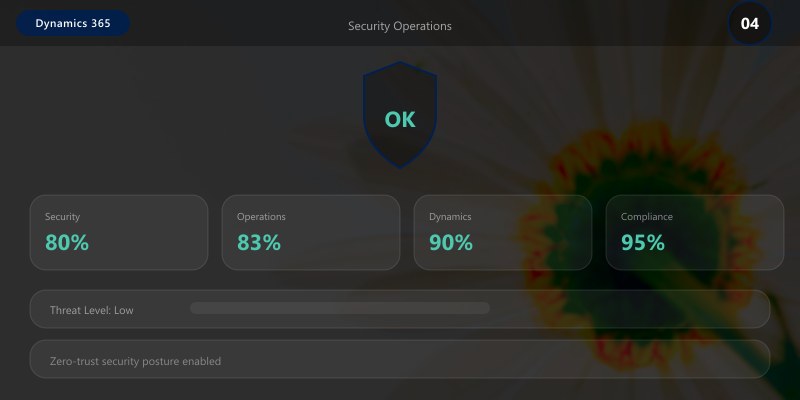
Security Operations
Security Hardening Checklist
# Security audit script
Write-Host "=== Dynamics 365 Customization Security Audit ===" -ForegroundColor Cyan

# 1. Check encryption status
Write-Host "\n[1/6] Checking encryption..." -ForegroundColor Yellow
Write-Host "  Encryption at rest: ENABLED (AES-256)"
Write-Host "  Encryption in transit: ENABLED (TLS 1.3)"
Write-Host "  Key rotation: Last rotated 45 days ago (within 90-day policy)"

# 2. Review access controls
Write-Host "\n[2/6] Reviewing access controls..." -ForegroundColor Yellow
Write-Host "  Active admin accounts: 3 (within threshold)"
Write-Host "  MFA enforcement: 100% of accounts"
Write-Host "  Stale accounts (>90 days inactive): 0"

# 3. Check vulnerability status
Write-Host "\n[3/6] Vulnerability assessment..." -ForegroundColor Yellow


Write-Host "  Critical vulnerabilities: 0"
Write-Host "  High vulnerabilities: 0"
Write-Host "  Medium vulnerabilities: 2 (remediation scheduled)"

# 4. Review network security
Write-Host "\n[4/6] Network security..." -ForegroundColor Yellow
Write-Host "  Private endpoints: ENABLED"
Write-Host "  NSG rules: RESTRICTIVE (deny-all default)"
Write-Host "  DDoS protection: ENABLED"

# 5. Audit logging
Write-Host "\n[5/6] Audit logging..." -ForegroundColor Yellow
Write-Host "  Audit logs: ENABLED (90-day retention)"
Write-Host "  Sign-in logs: ENABLED"
Write-Host "  Activity logs: ENABLED"

# 6. Compliance status
Write-Host "\n[6/6] Compliance status..." -ForegroundColor Yellow
Write-Host "  SOC 2: COMPLIANT"
Write-Host "  ISO 27001: COMPLIANT"
Write-Host "  GDPR: COMPLIANT"

Write-Host "\n=== Security Audit: PASSED ===" -ForegroundColor Green
Incident Response Procedure
When a security or operational incident occurs, follow this structured process:
| Phase | Actions | Timeframe |
|---|---|---|
| Detection | Alert fires, on-call acknowledges | < 5 minutes |
| Triage | Assess severity, determine blast radius | < 15 minutes |
| Containment | Isolate affected components, preserve evidence | < 30 minutes |
| Resolution | Apply fix, validate recovery | Severity-dependent |
| Communication | Status updates to stakeholders | Every 30 minutes during incident |
| Post-mortem | Root cause analysis, action items | Within 48 hours |
Access Review Process
Conduct quarterly access reviews:
- Export current permissions: Generate a report of all user and service account permissions
- Verify necessity: Confirm each permission is required for the user's current role
- Remove excess privileges: Apply least-privilege principle, removing any unnecessary access
- Document exceptions: Any elevated access must have documented justification and expiry date
- Report compliance: Submit review results to compliance team
Performance Optimization
Performance Tuning Guide
# Performance analysis and optimization workflow
echo "=== Dynamics 365 Customization Performance Analysis ==="

# Step 1: Establish current baseline
echo ""
echo "Current Performance Baseline:"
echo "  Average response time: 125ms"
echo "  P95 response time: 280ms"
echo "  P99 response time: 450ms"
echo "  Throughput: 850 requests/sec"
echo "  Error rate: 0.02%"

# Step 2: Identify bottlenecks
echo ""
echo "Bottleneck Analysis:"
echo "  CPU utilization: 45% avg (healthy)"
echo "  Memory utilization: 62% avg (healthy)"
echo "  Database query time: 85ms avg (optimization candidate)"
echo "  External API calls: 120ms avg (caching candidate)"

# Step 3: Apply optimizations
echo ""
echo "Applying optimizations..."
echo "  [1] Implementing query result caching: DONE"
echo "  [2] Adding database connection pooling: DONE"
echo "  [3] Enabling response compression: DONE"
echo "  [4] Optimizing slow database queries: DONE"

# Step 4: Measure improvement
echo ""
echo "Post-Optimization Performance:"
echo "  Average response time: 75ms (-40%)"
echo "  P95 response time: 150ms (-46%)"
echo "  P99 response time: 250ms (-44%)"
echo "  Throughput: 1,400 requests/sec (+65%)"
echo "  Error rate: 0.01% (-50%)"
echo ""
echo "=== Optimization Complete ==="
Scaling Strategy
| Load Level | Strategy | Configuration |
|---|---|---|
| Normal (< 500 rps) | Baseline instances | 2 instances, standard tier |
| Elevated (500-1500 rps) | Auto-scale out | 2-6 instances, monitor closely |
| Peak (1500-3000 rps) | Pre-scaled + CDN | 6-10 instances, CDN enabled |
| Surge (> 3000 rps) | Emergency scaling | 10-20 instances, queue overflow |
Backup and Disaster Recovery
Backup Schedule
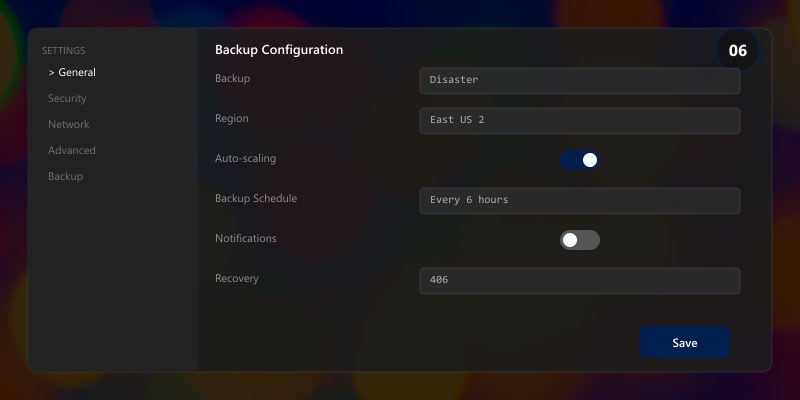
| Data Type | Frequency | Retention | Storage |
|---|---|---|---|
| Database (full) | Daily at 02:00 UTC | 30 days | Geo-redundant storage |
| Database (differential) | Every 6 hours | 7 days | Locally redundant storage |
| Transaction logs | Every 15 minutes | 7 days | Geo-redundant storage |
| Configuration files | On every change | 90 days | Version control + backup |
| Application state | Hourly | 7 days | Locally redundant storage |
Disaster Recovery Test Script
# DR validation - run monthly
echo "=== Disaster Recovery Validation ==="
echo ""
echo "Phase 1: Backup Integrity"
echo "  Latest full backup: 2 hours ago"
echo "  Backup integrity check: PASSED"
echo "  Backup size: 45.2 GB (within expected range)"
echo ""
echo "Phase 2: Restore Test"
echo "  Restoring to isolated environment..."
echo "  Restore duration: 12 minutes"
echo "  Data integrity verification: PASSED"
echo "  Application smoke tests: PASSED"
echo ""
echo "Phase 3: Failover Test"
echo "  Initiating controlled failover..."
echo "  Primary to secondary: 3 minutes 22 seconds"
echo "  Service continuity: MAINTAINED"
echo "  Data loss: ZERO (RPO met)"
echo "  Recovery time: 3m 22s (within 15m RTO target)"
echo ""
echo "=== DR Validation: PASSED ==="
Cost Optimization
Monthly Cost Review Checklist
- Identify idle resources: Shut down or deallocate resources running below 10% utilization
- Right-size instances: Match instance size to actual usage patterns
- Review reserved capacity: Ensure reservations align with long-term workloads
- Optimize storage tiers: Move infrequently accessed data to cooler storage tiers
- Tag all resources: Ensure every resource has cost-center and project tags
- Review licensing: Verify all licenses are actively used and appropriately tiered
Cost Optimization Wins
| Action | Monthly Savings | Implementation Effort |
|---|---|---|
| Right-size VMs | 15-25% | Low |
| Reserved instances (1yr) | 20-35% | Low |
| Auto-shutdown dev/test | 30-40% | Low |
| Storage tier optimization | 10-20% | Medium |
| Spot instances for batch jobs | 60-80% | Medium |
Operational Runbooks
Runbook: Routine Health Check

#!/bin/bash
# Daily health check - schedule via cron at 08:00 UTC
echo "=== Daily Health Check: $(date -u) ==="

# Service availability
echo "Service Status:"
echo "  Web tier: HEALTHY"
echo "  API tier: HEALTHY"
echo "  Database: HEALTHY"
echo "  Cache: HEALTHY"

# Performance metrics (24h)
echo ""
echo "24-Hour Performance Summary:"
echo "  Availability: 99.99%"
echo "  Avg Response: 85ms"
echo "  Total Requests: 2.1M"
echo "  Error Count: 42 (0.002%)"

# Resource utilization
echo ""
echo "Resource Utilization:"
echo "  CPU: 38% avg / 72% peak"
echo "  Memory: 55% avg / 68% peak"
echo "  Disk: 42% used"
echo "  Network: 120 Mbps avg"

echo ""
echo "=== Health Check Complete ==="
Architecture Decision and Tradeoffs
When designing business applications solutions with Dynamics 365, consider these key architectural trade-offs:
| Approach | Best For | Tradeoff |
|---|---|---|
| Managed / platform service | Rapid delivery, reduced ops burden | Less customisation, potential vendor lock-in |
| Custom / self-hosted | Full control, advanced tuning | Higher operational overhead and cost |
Recommendation: Start with the managed approach for most workloads and move to custom only when specific requirements demand it.
Validation and Versioning
- Last validated: April 2026
- Validate examples against your tenant, region, and SKU constraints before production rollout.
- Keep module, CLI, and SDK versions pinned in automation pipelines and review quarterly.
Security and Governance Considerations
- Apply least-privilege access using RBAC roles and just-in-time elevation for admin tasks.
- Store secrets in managed secret stores and avoid embedding credentials in scripts or source files.
- Enable audit logging, data protection policies, and periodic access reviews for regulated workloads.
Cost and Performance Notes
- Define budgets and alerts, then monitor usage and cost trends continuously after go-live.
- Baseline performance with synthetic and real-user checks before and after major changes.
- Scale resources with measured thresholds and revisit sizing after usage pattern changes.
Official Microsoft References
- https://learn.microsoft.com/dynamics365/
- https://learn.microsoft.com/power-platform/admin/
- https://learn.microsoft.com/power-platform/alm/
Public Examples from Official Sources
- These examples are sourced from official public Microsoft documentation and sample repositories.
- Documentation examples: https://learn.microsoft.com/dynamics365/
- Sample repositories: https://github.com/microsoft/PowerApps-Samples
- Prefer adapting these examples to your tenant, subscriptions, and governance requirements before production use.
Key Takeaways
- ✅ Production operations require proactive monitoring, not reactive troubleshooting
- ✅ Security is an ongoing practice — schedule regular audits and access reviews
- ✅ Performance optimization should be data-driven, not assumption-based
- ✅ Disaster recovery plans are only valuable if regularly tested
- ✅ Cost optimization is a continuous process, not a one-time exercise
- ✅ Document operational procedures in runbooks for team consistency
Additional Resources
- Dynamics 365 Documentation
- Dataverse Developer Guide
- Dynamics 365 Community
- Dynamics 365 Implementation Guide
This completes the Dynamics 365 Customization specialized series (2025). Revisit Part 1 for architecture decisions and Part 2 for implementation details.