Windows Server Performance Monitoring: Diagnostics and Optimization
ForEach-Object { Write-Host " $([math]::Round($_.CookedValue, 2))%" -ForegroundColor Green }
Memory
Write-Host 'nMemory:' -ForegroundColor Yellow $os = Get-CimInstance Win32_OperatingSystem$totalMem = [math]::Round($os.TotalVisibleMemorySize / 1MB, 2)$freeMem = [math]::Round($os.FreePhysicalMemory / 1MB, 2)$usedMem = $totalMem - $freeMem $memPercent = [math]::Round(($usedMem / $totalMem) * 100, 2)
Write-Host " Total: $totalMem GB" -ForegroundColor Green Write-Host " Used: $usedMem GB ($memPercent%)" -ForegroundColor Green Write-Host " Free: $freeMem GB" -ForegroundColor Green

Disk activity
Write-Host 'nDisk Activity:' -ForegroundColor Yellow Get-Counter '\PhysicalDisk(_Total)\Disk Bytes/sec' | Select-Object -ExpandProperty CounterSamples | ForEach-Object { $diskMBps = [math]::Round($_.CookedValue / 1MB, 2) Write-Host " $diskMBps MB/s" -ForegroundColor Green
}

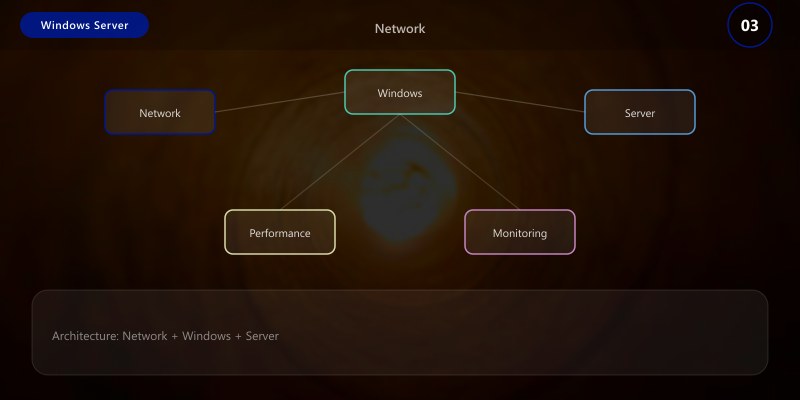
Network
Write-Host 'nNetwork Activity:' -ForegroundColor Yellow Get-Counter '\Network Interface(*)\Bytes Total/sec' | Select-Object -ExpandProperty CounterSamples | Where-Object { $.CookedValue -gt 0 } |
ForEach-Object {
$netMbps = [math]::Round(($.CookedValue * 8) / 1MB, 2)
Write-Host " $($_.InstanceName): `$netMbps Mbps" -ForegroundColor Green
}
Top CPU processes
Write-Host 'nTop CPU Processes:' -ForegroundColor Yellow Get-Process | Sort-Object CPU -Descending | Select-Object -First 5 | Format-Table Name, @{N='CPU(s)';E={[math]::Round($.CPU, 2)}}, @{N='Memory(MB)';E={[math]::Round(`$.WorkingSet64 / 1MB, 2)}} -AutoSize
Start-Sleep -Seconds 2```
}
"@
$monitorScript | Out-File "C:\Scripts\RealtimeMonitor.ps1"
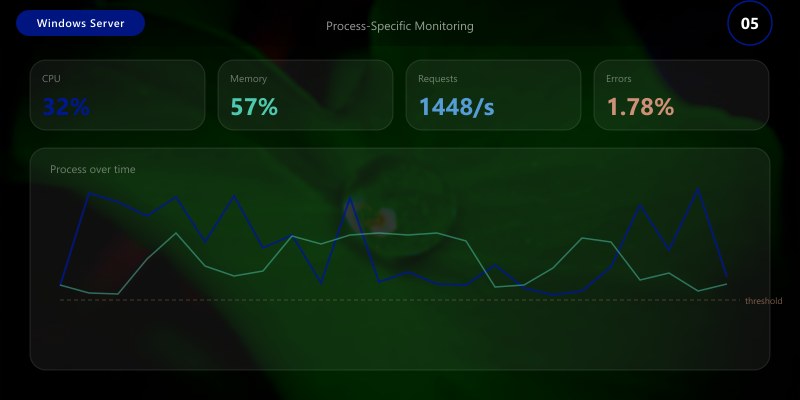
## Process-Specific Monitoring
```powershell
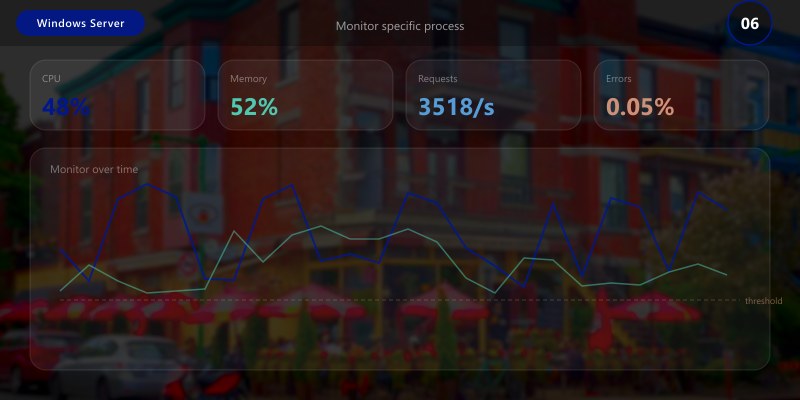
## Monitor specific process
$processName = "w3wp"
$process = Get-Process -Name $processName
## CPU usage
$cpuBefore = $process.CPU
Start-Sleep -Seconds 1
$process = Get-Process -Name $processName
$cpuAfter = $process.CPU
$cpuUsage = $cpuAfter - $cpuBefore

Write-Host "Process: $($process.Name)" -ForegroundColor Cyan
Write-Host "CPU: $([math]::Round($cpuUsage, 2)) seconds" -ForegroundColor Yellow
Write-Host "Memory: $([math]::Round($process.WorkingSet64 / 1MB, 2)) MB" -ForegroundColor Yellow
Write-Host "Threads: $($process.Threads.Count)" -ForegroundColor Yellow
Write-Host "Handles: $($process.HandleCount)" -ForegroundColor Yellow
## Get process threads
$process.Threads | Select-Object Id, ThreadState, TotalProcessorTime | Format-Table

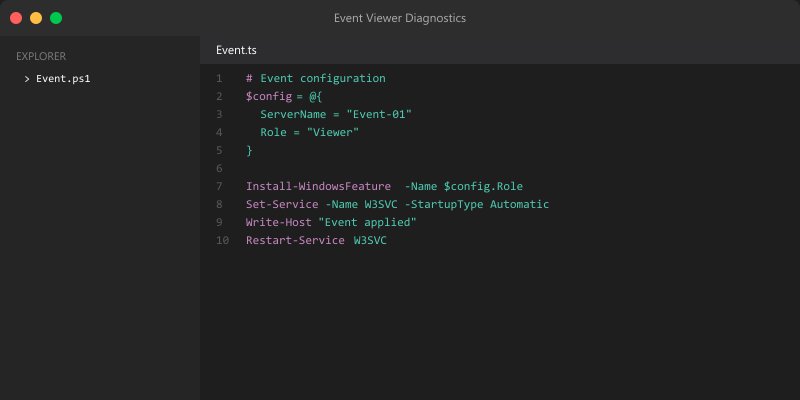
Event Viewer Diagnostics
Querying Event Logs
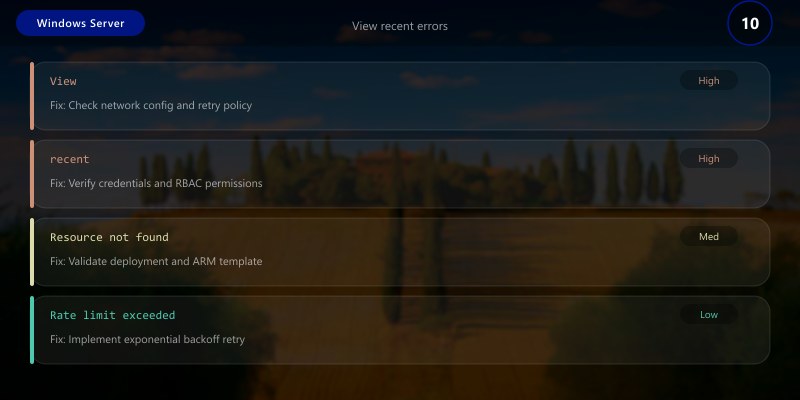
## View recent errors
Get-EventLog -LogName System -EntryType Error -Newest 50 |
```text
Select-Object TimeGenerated, Source, EventID, Message |
Format-Table -AutoSize
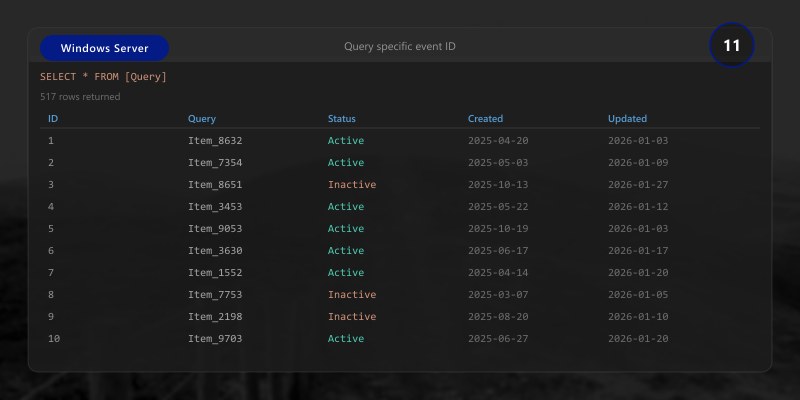
Query specific event ID
Get-EventLog -LogName System -InstanceId 1074 -Newest 20 # System shutdown events
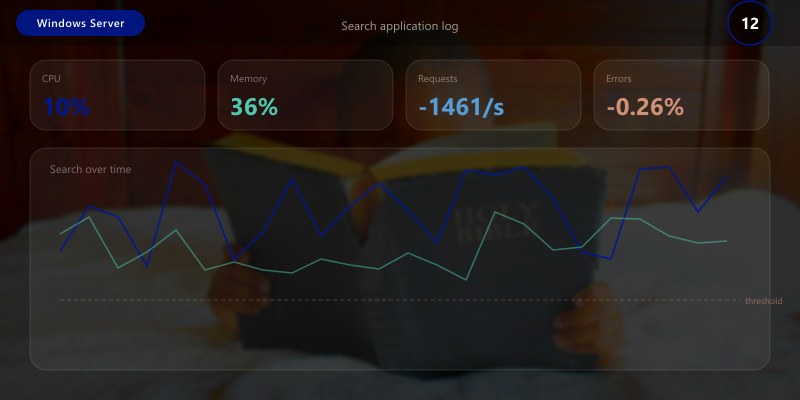
Search application log
Get-EventLog -LogName Application -EntryType Warning, Error -Newest 100 |
Group-Object Source |
Sort-Object Count -Descending |
Select-Object Count, Name |
Format-Table -AutoSize
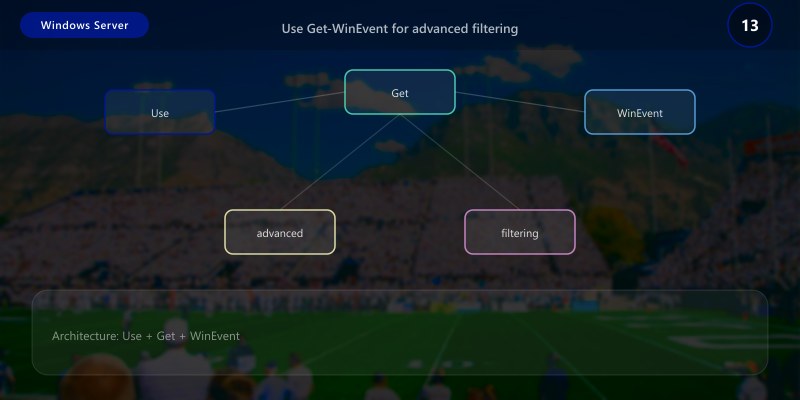
Use Get-WinEvent for advanced filtering

Figure: Power Apps gallery control – flexible item template with connected data source.
$filter = @{
LogName = 'System'
Level = 2  # Error
StartTime = (Get-Date).AddDays(-1)```
}
Get-WinEvent -FilterHashtable $filter |
```text
Select-Object TimeCreated, Id, LevelDisplayName, Message |
Format-Table -Wrap
## Creating Custom Views
```powershell
## Export custom view as XML
$viewXml = @"
<QueryList>
<Query Id="0" Path="System">
```sql
<Select Path="System">
*[System[(Level=1 or Level=2) and TimeCreated[timediff(@SystemTime) <= 86400000]]]
</Select>```
</Query>
</QueryList>
"@
$viewXml | Out-File "C:\EventViews\CriticalErrors-24h.xml"
## Query using custom view
Get-WinEvent -FilterXml (Get-Content "C:\EventViews\CriticalErrors-24h.xml" -Raw)
Event Subscriptions

Figure: Configuration and management dashboard with status overview.
## Configure event forwarding (requires WinRM)
Enable-PSRemoting -Force
## On collector server, configure subscription
wecutil cs /c:"C:\EventSubscriptions\RemoteErrors.xml"
## Example subscription XML
$subscriptionXml = @"
<Subscription xmlns="http://schemas.microsoft.com/2006/03/windows/events/subscription">
<SubscriptionId>RemoteErrors</SubscriptionId>
<Description>Collect errors from remote servers</Description>
<Uri>http://schemas.microsoft.com/wbem/wsman/1/windows/EventLog</Uri>
<ConfigurationMode>Custom</ConfigurationMode>
<Delivery Mode="Push">
```text
<Batching>
<MaxLatencyTime>300000</MaxLatencyTime>
</Batching>
<PushSettings>
<Heartbeat Interval="3600000"/>
</PushSettings>```
</Delivery>
<Query>
```sql
<![CDATA[
<QueryList>
<Query Id="0">
<Select Path="System">*[System[(Level=1 or Level=2)]]</Select>
</Query>
</QueryList>
]]>```
</Query>
<ReadExistingEvents>true</ReadExistingEvents>
<TransportName>http</TransportName>
<ContentFormat>RenderedText</ContentFormat>
<Locale Language="en-US"/>
</Subscription>
"@
$subscriptionXml | Out-File "C:\EventSubscriptions\RemoteErrors.xml"
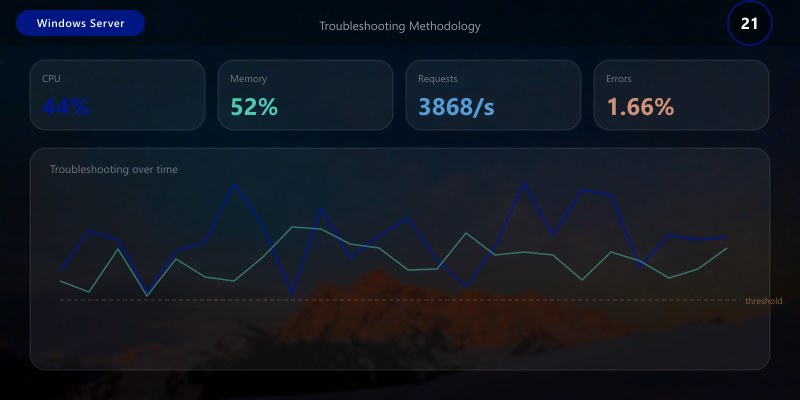
Troubleshooting Methodology
Systematic Diagnostics
## Performance diagnostics script
$diagScript = @"
Write-Host '========================================' -ForegroundColor Cyan
Write-Host 'Windows Server Performance Diagnostics' -ForegroundColor Cyan
Write-Host '========================================`n' -ForegroundColor Cyan
## 1. Identify symptoms
Write-Host '1. System Overview:' -ForegroundColor Yellow
`$os = Get-CimInstance Win32_OperatingSystem
Write-Host " OS: `$(`$os.Caption)" -ForegroundColor Green
Write-Host " Uptime: `$(([datetime]::Now - `$os.LastBootUpTime).Days) days" -ForegroundColor Green

## 2. Check CPU
Write-Host '`n2. CPU Analysis:' -ForegroundColor Yellow
`$cpu = Get-Counter '\Processor(_Total)\% Processor Time' | Select-Object -ExpandProperty CounterSamples
Write-Host " CPU Usage: `$([math]::Round(`$cpu.CookedValue, 2))%" -ForegroundColor $(if (`$cpu.CookedValue -gt 80) {'Red'} else {'Green'})
`$topCpuProcesses = Get-Process | Sort-Object CPU -Descending | Select-Object -First 5
Write-Host " Top CPU Processes:" -ForegroundColor Green
`$topCpuProcesses | Format-Table Name, @{N='CPU(s)';E={[math]::Round(`$_.CPU, 2)}} -AutoSize
## 3. Check Memory
Write-Host '3. Memory Analysis:' -ForegroundColor Yellow
`$freeMem = [math]::Round(`$os.FreePhysicalMemory / 1MB, 2)
Write-Host " Available Memory: `$freeMem GB" -ForegroundColor $(if (`$freeMem -lt 1) {'Red'} elseif (`$freeMem -lt 2) {'Yellow'} else {'Green'})

`$topMemProcesses = Get-Process | Sort-Object WorkingSet64 -Descending | Select-Object -First 5
Write-Host " Top Memory Processes:" -ForegroundColor Green
`$topMemProcesses | Format-Table Name, @{N='Memory(MB)';E={[math]::Round(`$_.WorkingSet64 / 1MB, 2)}} -AutoSize
## 4. Check Disk
Write-Host '4. Disk Analysis:' -ForegroundColor Yellow
Get-Volume | Where-Object { `$_.DriveLetter } | ForEach-Object {
```powershell
`$freePercent = [math]::Round((`$_.SizeRemaining / `$_.Size) * 100, 2)
`$color = if (`$freePercent -lt 10) {'Red'} elseif (`$freePercent -lt 20) {'Yellow'} else {'Green'}
Write-Host " `$(`$_.DriveLetter): `$freePercent% free" -ForegroundColor `$color```
}
`$diskQueue = Get-Counter '\PhysicalDisk(_Total)\Avg. Disk Queue Length' | Select-Object -ExpandProperty CounterSamples
Write-Host " Disk Queue: `$([math]::Round(`$diskQueue.CookedValue, 2))" -ForegroundColor $(if (`$diskQueue.CookedValue -gt 2) {'Red'} else {'Green'})
## 5. Check Network
Write-Host '`n5. Network Analysis:' -ForegroundColor Yellow
Get-NetAdapter | Where-Object { `$_.Status -eq 'Up' } | ForEach-Object {
```powershell
Write-Host " `$(`$_.Name): `$(`$_.LinkSpeed)" -ForegroundColor Green```
}
## 6. Recent errors
Write-Host '`n6. Recent Errors (Last 24h):' -ForegroundColor Yellow
`$errors = Get-EventLog -LogName System -EntryType Error -After (Get-Date).AddDays(-1) -ErrorAction SilentlyContinue
Write-Host " System Errors: `$(`$errors.Count)" -ForegroundColor $(if (`$errors.Count -gt 10) {'Red'} else {'Green'})
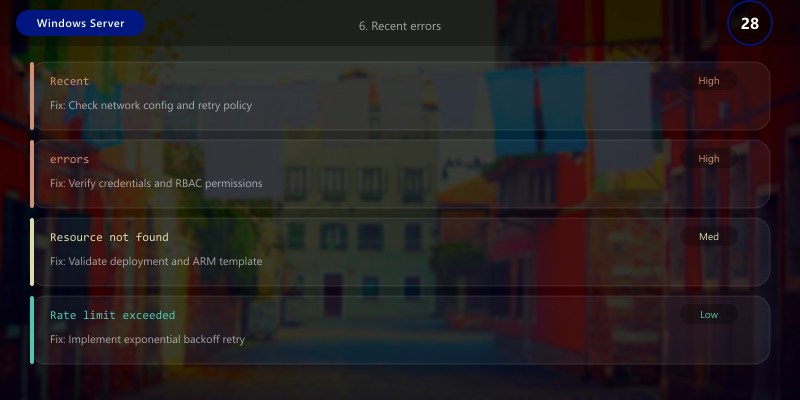
if (`$errors.Count -gt 0) {
```text
`$errorGroups = `$errors | Group-Object Source | Sort-Object Count -Descending | Select-Object -First 5
Write-Host " Top Error Sources:" -ForegroundColor Green
`$errorGroups | Format-Table Count, Name -AutoSize```
}
Write-Host '`n========================================' -ForegroundColor Cyan
Write-Host 'Diagnostics Complete' -ForegroundColor Cyan
Write-Host '========================================' -ForegroundColor Cyan
"@
$diagScript | Out-File "C:\Scripts\PerformanceDiag.ps1"
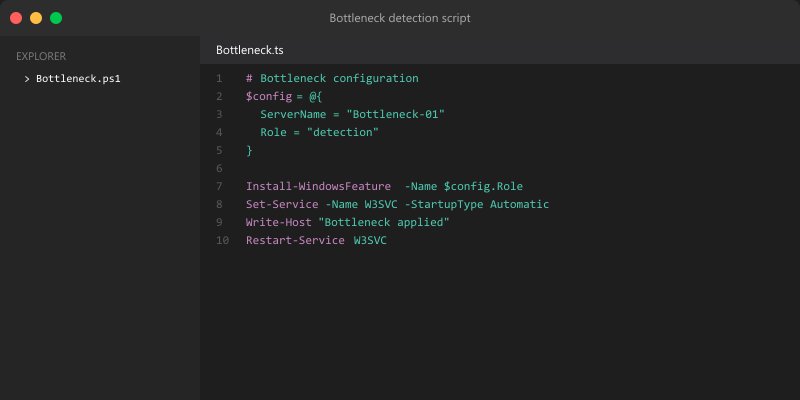
Bottleneck Identification

Figure: Copilot Studio – topic flow designer with test chat panel.
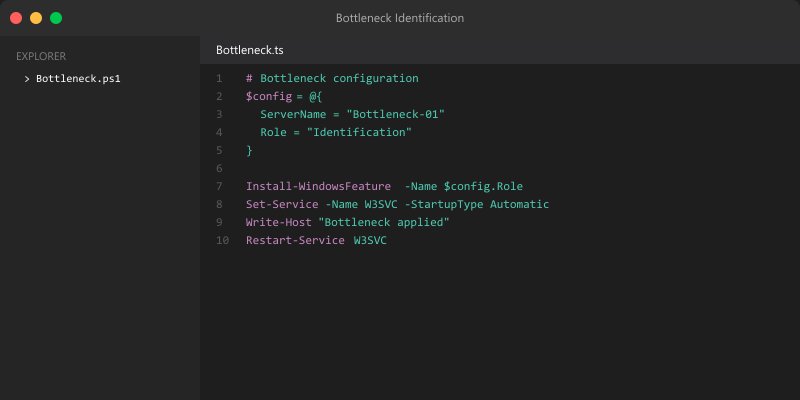
## Bottleneck detection script
$bottleneckScript = @"
function Test-CPUBottleneck {
```powershell
`$cpu = (Get-Counter '\Processor(_Total)\% Processor Time').CounterSamples.CookedValue
`$queueLength = (Get-Counter '\System\Processor Queue Length').CounterSamples.CookedValue
if (`$cpu -gt 80 -or `$queueLength -gt 10) {
[PSCustomObject]@{
Type = 'CPU'
Severity = if (`$cpu -gt 90) {'Critical'} else {'Warning'}
Details = "CPU: `$([math]::Round(`$cpu, 2))%, Queue: `$queueLength"
Recommendation = 'Identify high CPU processes. Consider adding CPU cores or optimizing applications.'
}
}```
}
function Test-MemoryBottleneck {
```powershell
`$os = Get-CimInstance Win32_OperatingSystem
`$freeGB = `$os.FreePhysicalMemory / 1MB
`$pagesPerSec = (Get-Counter '\Memory\Pages/sec').CounterSamples.CookedValue
if (`$freeGB -lt 1 -or `$pagesPerSec -gt 1000) {
[PSCustomObject]@{
Type = 'Memory'
Severity = if (`$freeGB -lt 0.5) {'Critical'} else {'Warning'}
Details = "Free: `$([math]::Round(`$freeGB, 2)) GB, Paging: `$([math]::Round(`$pagesPerSec, 0))/sec"
Recommendation = 'Close unnecessary applications. Add more RAM or optimize memory usage.'
}
}```
}
function Test-DiskBottleneck {
```powershell
`$diskQueue = (Get-Counter '\PhysicalDisk(_Total)\Avg. Disk Queue Length').CounterSamples.CookedValue
`$diskLatency = (Get-Counter '\PhysicalDisk(_Total)\Avg. Disk sec/Read').CounterSamples.CookedValue * 1000
if (`$diskQueue -gt 2 -or `$diskLatency -gt 20) {
[PSCustomObject]@{
Type = 'Disk'
Severity = if (`$diskQueue -gt 5 -or `$diskLatency -gt 50) {'Critical'} else {'Warning'}
Details = "Queue: `$([math]::Round(`$diskQueue, 2)), Latency: `$([math]::Round(`$diskLatency, 2)) ms"
Recommendation = 'Check disk health. Upgrade to SSD or add more disks. Optimize I/O patterns.'
}
}```
}
function Test-NetworkBottleneck {
```powershell
`$adapters = Get-NetAdapter | Where-Object { `$_.Status -eq 'Up' }
foreach (`$adapter in `$adapters) {
`$counter = Get-Counter "\Network Interface(`$(`$adapter.InterfaceDescription))\Output Queue Length" -ErrorAction SilentlyContinue
if (`$counter -and `$counter.CounterSamples.CookedValue -gt 2) {
[PSCustomObject]@{
Type = 'Network'
Severity = 'Warning'
Details = "`$(`$adapter.Name): Output queue `$(`$counter.CounterSamples.CookedValue)"
Recommendation = 'Check network utilization. Upgrade network adapter or optimize network traffic.'
}
}
}```
}
Write-Host 'Scanning for performance bottlenecks...' -ForegroundColor Cyan
`$bottlenecks = @()
`$bottlenecks += Test-CPUBottleneck
`$bottlenecks += Test-MemoryBottleneck
`$bottlenecks += Test-DiskBottleneck
`$bottlenecks += Test-NetworkBottleneck
if (`$bottlenecks) {
```text
Write-Host '`nBottlenecks detected:' -ForegroundColor Red
`$bottlenecks | Format-Table Type, Severity, Details, Recommendation -Wrap```
} else {
```text
Write-Host '`nNo bottlenecks detected. System performance is healthy.' -ForegroundColor Green```
}
"@
$bottleneckScript | Out-File "C:\Scripts\DetectBottlenecks.ps1"
Optimization Techniques
Service Optimization
## Disable unnecessary services
$servicesToDisable = @(
```text
'XblAuthManager' # Xbox Live Auth Manager
'XblGameSave' # Xbox Live Game Save
'XboxGipSvc' # Xbox Accessory Management
'XboxNetApiSvc' # Xbox Live Networking```
)

foreach ($service in $servicesToDisable) {
```powershell
$svc = Get-Service -Name $service -ErrorAction SilentlyContinue
if ($svc) {
Stop-Service -Name $service -Force
Set-Service -Name $service -StartupType Disabled
Write-Host "Disabled: $service" -ForegroundColor Green
}```
}
Visual Effects Optimization

Figure: Power BI Desktop – report canvas with visuals, fields, and format pane.
## Disable visual effects for better performance
$regPath = "HKCU:\Software\Microsoft\Windows\CurrentVersion\Explorer\VisualEffects"
Set-ItemProperty -Path $regPath -Name "VisualFXSetting" -Value 2 # Best performance
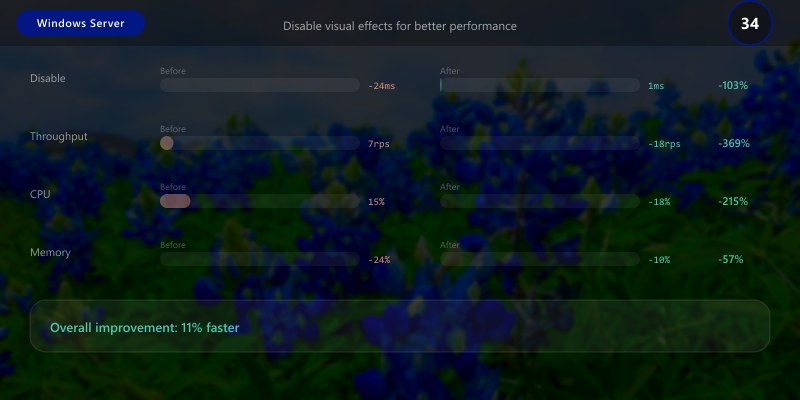
## Disable animations
Set-ItemProperty -Path "HKCU:\Control Panel\Desktop\WindowMetrics" -Name "MinAnimate" -Value "0"

Startup Optimization
## List startup programs
Get-CimInstance Win32_StartupCommand |
```text
Select-Object Name, Command, Location, User |
Format-Table -AutoSize

Disable startup program (use Task Manager or modify registry)
Remove-ItemProperty -Path "HKLM:\SOFTWARE\Microsoft\Windows\CurrentVersion\Run" -Name "ProgramName"

Figure: SharePoint Migration Tool – progress dashboard with status and error log.
## Architecture Decision and Tradeoffs
When designing server infrastructure solutions with Windows Server, consider these key architectural trade-offs:
| Approach | Best For | Tradeoff |
|----------|----------|----------|
| Managed / platform service | Rapid delivery, reduced ops burden | Less customisation, potential vendor lock-in |
| Custom / self-hosted | Full control, advanced tuning | Higher operational overhead and cost |
> **Recommendation:** Start with the managed approach for most workloads and move to custom only when specific requirements demand it.
## Validation and Versioning
- Last validated: April 2026
- Validate examples against your tenant, region, and SKU constraints before production rollout.
- Keep module, CLI, and SDK versions pinned in automation pipelines and review quarterly.
## Security and Governance Considerations
- Apply least-privilege access using RBAC roles and just-in-time elevation for admin tasks.
- Store secrets in managed secret stores and avoid embedding credentials in scripts or source files.
- Enable audit logging, data protection policies, and periodic access reviews for regulated workloads.
## Cost and Performance Notes
- Define budgets and alerts, then monitor usage and cost trends continuously after go-live.
- Baseline performance with synthetic and real-user checks before and after major changes.
- Scale resources with measured thresholds and revisit sizing after usage pattern changes.
## Official Microsoft References
- https://learn.microsoft.com/windows-server/
- https://learn.microsoft.com/windows/security/
- https://learn.microsoft.com/azure/azure-arc/
## Public Examples from Official Sources
- These examples are sourced from official public Microsoft documentation and sample repositories.
- Documentation examples: https://learn.microsoft.com/windows-server/
- Sample repositories: https://github.com/microsoft/Windows-Containers
- Prefer adapting these examples to your tenant, subscriptions, and governance requirements before production use.
## Key Takeaways
- Performance Monitor tracks CPU, memory, disk, and network metrics
- Data collector sets gather performance data over time
- Resource Monitor provides real-time resource analysis
- Event Viewer diagnoses system and application errors
- Systematic methodology identifies performance bottlenecks
- CPU, memory, disk, and network bottlenecks require different solutions
- Service and startup optimization improves system performance
- Regular monitoring prevents performance degradation
## Next Steps
- Set up performance monitoring with data collectors
- Create custom Event Viewer filters for critical events
- Implement automated performance diagnostics
- Establish performance baselines
- Schedule regular bottleneck scans
- Optimize services and startup programs
- Document performance trends
## Additional Resources
- [Performance Monitor](https://learn.microsoft.com/windows-server/administration/windows-commands/perfmon)
- [Resource Monitor](https://learn.microsoft.com/previous-versions/windows/it-pro/windows-server-2012-R2-and-2012/cc770601(v=ws.11))
- [Event Viewer](https://learn.microsoft.com/shows/inside/event-viewer)
- [Performance Tuning](https://learn.microsoft.com/windows-server/administration/performance-tuning/)
---
*Monitor. Diagnose. Optimize. Improve.*