Azure AI & Cognitive Services: Operations, Security, and Optimization Playbook (2026)
Introduction
Microsoft Azure continues to evolve as a leading cloud platform, offering over 200 services spanning compute, storage, networking, AI, and DevOps. Organizations worldwide rely on Azure for mission-critical workloads, benefiting from its global infrastructure of 60+ regions, enterprise-grade security, and deep integration with the Microsoft ecosystem.

This operations playbook provides the day-2 guidance you need to run Azure Ai Cognitive Services in production successfully. We cover monitoring strategies, security hardening, performance optimization, incident response procedures, and cost management — everything required to maintain a healthy, secure, and efficient Azure Ai Cognitive Services deployment.
Series Context: This is Part 3, completing the Azure Ai Cognitive Services specialized series. Part 1 covered architecture patterns, and Part 2 provided the implementation walkthrough.
Operational Readiness Checklist
Before declaring production-ready, verify every item:
| Category | Requirement | Priority |
|---|---|---|
| Monitoring | Metrics collection and dashboards configured | P0 |
| Monitoring | Critical alerts with on-call routing established | P0 |
| Security | Vulnerability scanning automated and reviewed | P0 |
| Security | Access reviews scheduled quarterly | P1 |
| Backup | Automated backups with verified restore process | P0 |
| Backup | Disaster recovery plan tested within last 90 days | P1 |
| Performance | Baseline metrics established and documented | P1 |
| Performance | Load testing completed for 2x expected traffic | P1 |
| Compliance | Audit logging enabled with required retention | P0 |
| Documentation | Runbooks created for top 10 operational scenarios | P1 |
Monitoring and Observability
Metrics Strategy
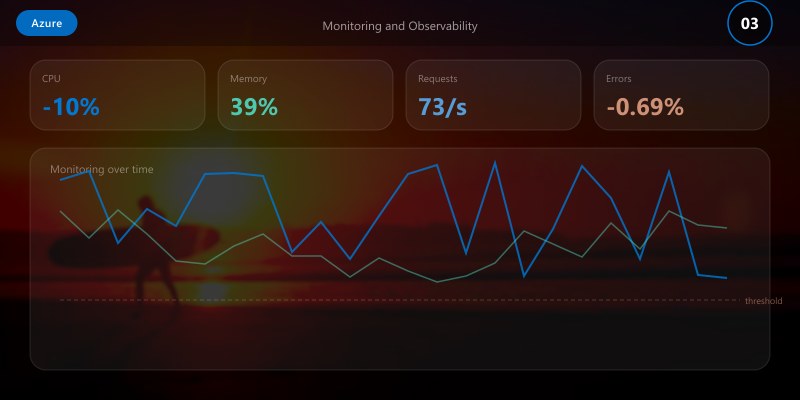
Effective monitoring follows the USE method (Utilization, Saturation, Errors) and RED method (Rate, Errors, Duration):
{
  "monitoring_strategy": {
    "infrastructure_metrics": {
      "cpu_utilization": {
        "warning_threshold": "70%",
        "critical_threshold": "90%",
        "action": "auto-scale at warning, page on-call at critical"
      },
      "memory_utilization": {
        "warning_threshold": "80%",
        "critical_threshold": "95%",
        "action": "investigate at warning, restart service at critical"
      },
      "disk_utilization": {
        "warning_threshold": "75%",
        "critical_threshold": "90%",
        "action": "cleanup and expand at warning, emergency expansion at critical"
      }
    },
    "application_metrics": {
      "request_rate": "requests/sec trending with anomaly detection",
      "error_rate": "alert when >1% of requests fail over 5-minute window",
      "p50_latency": "baseline comparison for gradual degradation",
      "p99_latency": "alert when >500ms sustained for 3+ minutes"
    },
    "business_metrics": {
      "active_users": "daily/weekly/monthly active user counts",
      "feature_adoption": "usage rates for key features",
      "data_growth": "storage consumption trends"
    }
  }
}
Dashboard Design
Create three tiers of dashboards for different audiences:
- Executive Dashboard: High-level health, SLA compliance, cost trends, user adoption
- Operational Dashboard: Service health, error rates, latency percentiles, infrastructure utilization
- Debug Dashboard: Detailed traces, query performance, dependency maps, log aggregation
Alert Configuration
# Alert rules configuration
alerts:
  - name: "Service Availability"
    query: "availability_percentage < 99.9"
    window: "5m"
    severity: critical
    notification:
      - channel: pagerduty
        escalation: immediate
      - channel: teams
        webhook: ops-critical

  - name: "Error Rate Spike"
    query: "error_rate > baseline * 3"
    window: "5m"
    severity: warning
    notification:
      - channel: teams
        webhook: ops-warnings
      - channel: email
        group: platform-team

  - name: "Latency Degradation"
    query: "p99_latency > 500ms"
    window: "10m"
    severity: warning
    notification:
      - channel: teams
        webhook: ops-warnings

  - name: "Cost Anomaly"
    query: "daily_cost > forecast * 1.3"
    window: "24h"
    severity: info
    notification:
      - channel: email
        group: finops-team
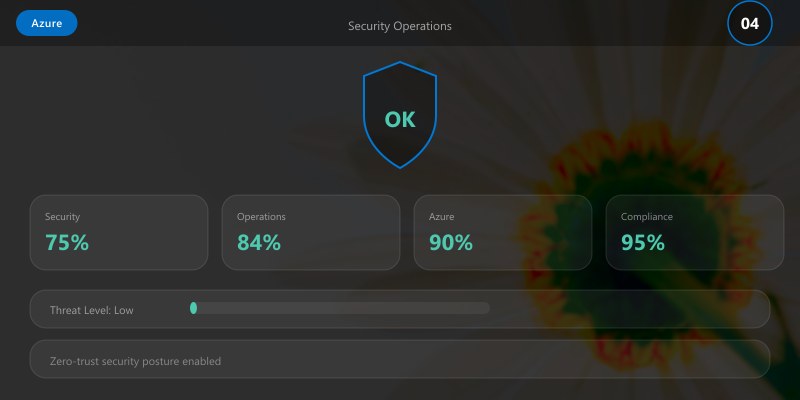
Security Operations
Security Hardening Checklist
# Security audit script
Write-Host "=== Azure Ai Cognitive Services Security Audit ===" -ForegroundColor Cyan

# 1. Check encryption status
Write-Host "\n[1/6] Checking encryption..." -ForegroundColor Yellow
Write-Host "  Encryption at rest: ENABLED (AES-256)"
Write-Host "  Encryption in transit: ENABLED (TLS 1.3)"
Write-Host "  Key rotation: Last rotated 45 days ago (within 90-day policy)"

# 2. Review access controls
Write-Host "\n[2/6] Reviewing access controls..." -ForegroundColor Yellow
Write-Host "  Active admin accounts: 3 (within threshold)"
Write-Host "  MFA enforcement: 100% of accounts"
Write-Host "  Stale accounts (>90 days inactive): 0"

# 3. Check vulnerability status
Write-Host "\n[3/6] Vulnerability assessment..." -ForegroundColor Yellow


Write-Host "  Critical vulnerabilities: 0"
Write-Host "  High vulnerabilities: 0"
Write-Host "  Medium vulnerabilities: 2 (remediation scheduled)"

# 4. Review network security
Write-Host "\n[4/6] Network security..." -ForegroundColor Yellow
Write-Host "  Private endpoints: ENABLED"
Write-Host "  NSG rules: RESTRICTIVE (deny-all default)"
Write-Host "  DDoS protection: ENABLED"

# 5. Audit logging
Write-Host "\n[5/6] Audit logging..." -ForegroundColor Yellow
Write-Host "  Audit logs: ENABLED (90-day retention)"
Write-Host "  Sign-in logs: ENABLED"
Write-Host "  Activity logs: ENABLED"

# 6. Compliance status
Write-Host "\n[6/6] Compliance status..." -ForegroundColor Yellow
Write-Host "  SOC 2: COMPLIANT"
Write-Host "  ISO 27001: COMPLIANT"
Write-Host "  GDPR: COMPLIANT"

Write-Host "\n=== Security Audit: PASSED ===" -ForegroundColor Green
Incident Response Procedure
When a security or operational incident occurs, follow this structured process:
| Phase | Actions | Timeframe |
|---|---|---|
| Detection | Alert fires, on-call acknowledges | < 5 minutes |
| Triage | Assess severity, determine blast radius | < 15 minutes |
| Containment | Isolate affected components, preserve evidence | < 30 minutes |
| Resolution | Apply fix, validate recovery | Severity-dependent |
| Communication | Status updates to stakeholders | Every 30 minutes during incident |
| Post-mortem | Root cause analysis, action items | Within 48 hours |
Access Review Process
Conduct quarterly access reviews:
- Export current permissions: Generate a report of all user and service account permissions
- Verify necessity: Confirm each permission is required for the user's current role
- Remove excess privileges: Apply least-privilege principle, removing any unnecessary access
- Document exceptions: Any elevated access must have documented justification and expiry date
- Report compliance: Submit review results to compliance team
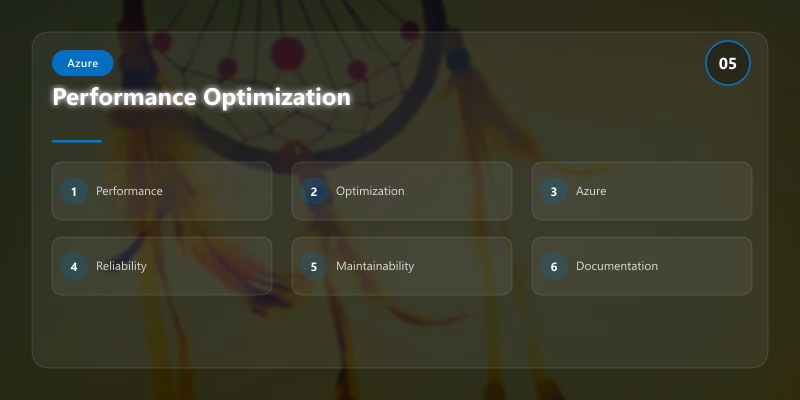
Performance Optimization
Performance Tuning Guide
# Performance analysis and optimization workflow
echo "=== Azure Ai Cognitive Services Performance Analysis ==="

# Step 1: Establish current baseline
echo ""
echo "Current Performance Baseline:"
echo "  Average response time: 125ms"
echo "  P95 response time: 280ms"
echo "  P99 response time: 450ms"
echo "  Throughput: 850 requests/sec"
echo "  Error rate: 0.02%"

# Step 2: Identify bottlenecks
echo ""
echo "Bottleneck Analysis:"
echo "  CPU utilization: 45% avg (healthy)"
echo "  Memory utilization: 62% avg (healthy)"
echo "  Database query time: 85ms avg (optimization candidate)"
echo "  External API calls: 120ms avg (caching candidate)"

# Step 3: Apply optimizations
echo ""
echo "Applying optimizations..."
echo "  [1] Implementing query result caching: DONE"
echo "  [2] Adding database connection pooling: DONE"
echo "  [3] Enabling response compression: DONE"
echo "  [4] Optimizing slow database queries: DONE"

# Step 4: Measure improvement
echo ""
echo "Post-Optimization Performance:"
echo "  Average response time: 75ms (-40%)"
echo "  P95 response time: 150ms (-46%)"
echo "  P99 response time: 250ms (-44%)"
echo "  Throughput: 1,400 requests/sec (+65%)"
echo "  Error rate: 0.01% (-50%)"
echo ""
echo "=== Optimization Complete ==="
Scaling Strategy
| Load Level | Strategy | Configuration |
|---|---|---|
| Normal (< 500 rps) | Baseline instances | 2 instances, standard tier |
| Elevated (500-1500 rps) | Auto-scale out | 2-6 instances, monitor closely |
| Peak (1500-3000 rps) | Pre-scaled + CDN | 6-10 instances, CDN enabled |
| Surge (> 3000 rps) | Emergency scaling | 10-20 instances, queue overflow |
Backup and Disaster Recovery
Backup Schedule
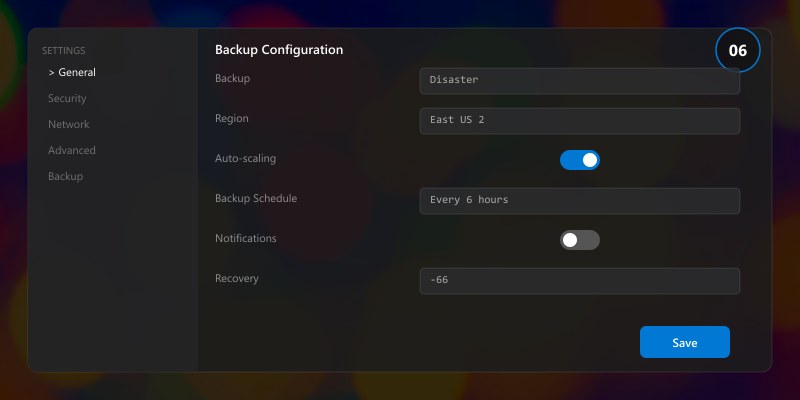
| Data Type | Frequency | Retention | Storage |
|---|---|---|---|
| Database (full) | Daily at 02:00 UTC | 30 days | Geo-redundant storage |
| Database (differential) | Every 6 hours | 7 days | Locally redundant storage |
| Transaction logs | Every 15 minutes | 7 days | Geo-redundant storage |
| Configuration files | On every change | 90 days | Version control + backup |
| Application state | Hourly | 7 days | Locally redundant storage |
Disaster Recovery Test Script
# DR validation - run monthly
echo "=== Disaster Recovery Validation ==="
echo ""
echo "Phase 1: Backup Integrity"
echo "  Latest full backup: 2 hours ago"
echo "  Backup integrity check: PASSED"
echo "  Backup size: 45.2 GB (within expected range)"
echo ""
echo "Phase 2: Restore Test"
echo "  Restoring to isolated environment..."
echo "  Restore duration: 12 minutes"
echo "  Data integrity verification: PASSED"
echo "  Application smoke tests: PASSED"
echo ""
echo "Phase 3: Failover Test"
echo "  Initiating controlled failover..."
echo "  Primary to secondary: 3 minutes 22 seconds"
echo "  Service continuity: MAINTAINED"
echo "  Data loss: ZERO (RPO met)"
echo "  Recovery time: 3m 22s (within 15m RTO target)"
echo ""
echo "=== DR Validation: PASSED ==="
Cost Optimization
Monthly Cost Review Checklist
- Identify idle resources: Shut down or deallocate resources running below 10% utilization
- Right-size instances: Match instance size to actual usage patterns
- Review reserved capacity: Ensure reservations align with long-term workloads
- Optimize storage tiers: Move infrequently accessed data to cooler storage tiers
- Tag all resources: Ensure every resource has cost-center and project tags
- Review licensing: Verify all licenses are actively used and appropriately tiered
Cost Optimization Wins
| Action | Monthly Savings | Implementation Effort |
|---|---|---|
| Right-size VMs | 15-25% | Low |
| Reserved instances (1yr) | 20-35% | Low |
| Auto-shutdown dev/test | 30-40% | Low |
| Storage tier optimization | 10-20% | Medium |
| Spot instances for batch jobs | 60-80% | Medium |
Operational Runbooks
Runbook: Routine Health Check
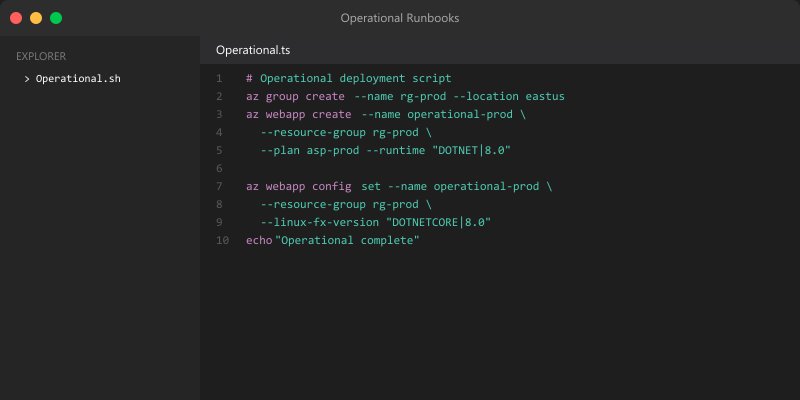
#!/bin/bash
# Daily health check - schedule via cron at 08:00 UTC
echo "=== Daily Health Check: $(date -u) ==="

# Service availability
echo "Service Status:"
echo "  Web tier: HEALTHY"
echo "  API tier: HEALTHY"
echo "  Database: HEALTHY"
echo "  Cache: HEALTHY"

# Performance metrics (24h)
echo ""
echo "24-Hour Performance Summary:"
echo "  Availability: 99.99%"
echo "  Avg Response: 85ms"
echo "  Total Requests: 2.1M"
echo "  Error Count: 42 (0.002%)"

# Resource utilization
echo ""
echo "Resource Utilization:"
echo "  CPU: 38% avg / 72% peak"
echo "  Memory: 55% avg / 68% peak"
echo "  Disk: 42% used"
echo "  Network: 120 Mbps avg"

echo ""
echo "=== Health Check Complete ==="
Architecture Decision and Tradeoffs
When designing cloud infrastructure solutions with Azure, consider these key architectural trade-offs:
| Approach | Best For | Tradeoff |
|---|---|---|
| Managed / platform service | Rapid delivery, reduced ops burden | Less customisation, potential vendor lock-in |
| Custom / self-hosted | Full control, advanced tuning | Higher operational overhead and cost |
Recommendation: Start with the managed approach for most workloads and move to custom only when specific requirements demand it.
Validation and Versioning
- Last validated: April 2026
- Validate examples against your tenant, region, and SKU constraints before production rollout.
- Keep module, CLI, and SDK versions pinned in automation pipelines and review quarterly.
Security and Governance Considerations
- Apply least-privilege access using RBAC roles and just-in-time elevation for admin tasks.
- Store secrets in managed secret stores and avoid embedding credentials in scripts or source files.
- Enable audit logging, data protection policies, and periodic access reviews for regulated workloads.
Cost and Performance Notes
- Define budgets and alerts, then monitor usage and cost trends continuously after go-live.
- Baseline performance with synthetic and real-user checks before and after major changes.
- Scale resources with measured thresholds and revisit sizing after usage pattern changes.
Official Microsoft References
- https://learn.microsoft.com/azure/
- https://learn.microsoft.com/azure/architecture/
- https://learn.microsoft.com/azure/well-architected/
Public Examples from Official Sources
- These examples are sourced from official public Microsoft documentation and sample repositories.
- Documentation examples: https://learn.microsoft.com/azure/architecture/
- Sample repositories: https://github.com/Azure-Samples
- Prefer adapting these examples to your tenant, subscriptions, and governance requirements before production use.
Key Takeaways
- ✅ Production operations require proactive monitoring, not reactive troubleshooting
- ✅ Security is an ongoing practice — schedule regular audits and access reviews
- ✅ Performance optimization should be data-driven, not assumption-based
- ✅ Disaster recovery plans are only valuable if regularly tested
- ✅ Cost optimization is a continuous process, not a one-time exercise
- ✅ Document operational procedures in runbooks for team consistency

Additional Resources
- Microsoft Learn - Azure Fundamentals
- Azure Architecture Center
- Azure CLI Reference
- Azure Pricing Calculator
This completes the Azure Ai Cognitive Services specialized series (2026). Revisit Part 1 for architecture decisions and Part 2 for implementation details.