Azure Monitor and Application Insights: Complete Observability
options.ConnectionString = builder.Configuration["ApplicationInsights:ConnectionString"];
options.EnableAdaptiveSampling = true;
options.EnableQuickPulseMetricStream = true;```
});
var app = builder.Build();
// Middleware for request tracking
app.UseHttpsRedirection();
app.UseAuthorization();
app.MapControllers();
app.Run();
**Custom Telemetry:**

```csharp
public class OrderController : ControllerBase
{
```csharp
private readonly TelemetryClient _telemetry;

public OrderController(TelemetryClient telemetry)
{
    _telemetry = telemetry;
}

[HttpPost]
public async Task<IActionResult> CreateOrder(Order order)
{
    using var operation = _telemetry.StartOperation<RequestTelemetry>("CreateOrder");

    try
    {
        // Custom event
        _telemetry.TrackEvent("OrderCreated", new Dictionary<string, string>
        {
            ["OrderId"] = order.Id,
            ["CustomerId"] = order.CustomerId,
            ["Amount"] = order.Total.ToString()
        });

        // Custom metric
        _telemetry.TrackMetric("OrderValue", order.Total);

        // Dependency tracking (auto-captured for HTTP/SQL)
        await _repository.SaveOrderAsync(order);

        return Ok(order);
    }
    catch (Exception ex)
    {
        _telemetry.TrackException(ex);
        operation.Telemetry.Success = false;
        throw;
    }
}```
}
Node.js:
const appInsights = require('applicationinsights');
appInsights.setup('InstrumentationKey=...')
```text
.setAutoDependencyCorrelation(true)
.setAutoCollectRequests(true)
.setAutoCollectPerformance(true)
.start();
const client = appInsights.defaultClient;
app.post('/orders', async (req, res) => {
client.trackEvent({ name: 'OrderCreated', properties: { orderId: req.body.id } });
client.trackMetric({ name: 'OrderValue', value: req.body.total });

try {
    await saveOrder(req.body);
    res.json({ success: true });
} catch (error) {
    client.trackException({ exception: error });
    res.status(500).json({ error: error.message });
}```
});
Step 3: KQL Queries for Insights
Failed Requests Analysis:
requests
| where success == false
| where timestamp > ago(24h)
| summarize FailureCount = count() by operation_Name, resultCode
| order by FailureCount desc
| take 10
Slow Request Identification:
requests
| where timestamp > ago(1h)
| where duration > 5000  // milliseconds
| project timestamp, operation_Name, duration, url
| order by duration desc
Dependency Performance:
dependencies
| where timestamp > ago(24h)
| summarize
```text
AvgDuration = avg(duration),
P95Duration = percentile(duration, 95),
FailureRate = countif(success == false) * 100.0 / count()
by target, type```
| order by P95Duration desc
User Journey Tracking:
customEvents
| where timestamp > ago(7d)
| where name in ("ProductViewed", "AddedToCart", "CheckoutStarted", "OrderCompleted")
| summarize EventCount = count() by name
| render piechart
Funnel Analysis:
let startDate = ago(30d);
let endDate = now();
customEvents
| where timestamp between (startDate .. endDate)
| where name in ("ProductViewed", "AddedToCart", "CheckoutStarted", "OrderCompleted")
| summarize Users = dcount(user_Id) by name
| order by Users desc
Step 4: Distributed Tracing
View End-to-End Transaction:
union requests, dependencies, exceptions
| where operation_Id == "abc123..."
| project timestamp, itemType, name, duration, success
| order by timestamp asc
Service Map Visualization:
Application Insights → Investigate → Application Map
Detect Anomalies:
requests
| where timestamp > ago(7d)
| make-series RequestCount = count() default = 0 on timestamp step 1h
| extend anomalies = series_decompose_anomalies(RequestCount, 1.5)
| mv-expand timestamp to typeof(datetime), RequestCount to typeof(long), anomalies to typeof(double)
| where anomalies != 0
Step 5: Infrastructure Monitoring
VM Metrics:
az monitor metrics list \
  --resource /subscriptions/.../resourceGroups/rg-vms/providers/Microsoft.Compute/virtualMachines/vm-web \
  --metric "Percentage CPU" \
  --start-time 2025-08-04T00:00:00Z \
  --end-time 2025-08-04T23:59:59Z \
  --interval PT1H
Expected output:
{ "value": [{ "name": { "value": "Requests" }, "timeseries": [{ "data": [{ "total": 1234 }] }] }] }

Container Insights (AKS):
ContainerLog
| where TimeGenerated > ago(1h)
| where ContainerName == "api-orders"
| where LogEntry contains "error"
| project TimeGenerated, LogEntry
VM Insights:
InsightsMetrics
| where TimeGenerated > ago(1h)
| where Name == "AvailableMB"
| summarize AvgMemoryMB = avg(Val) by Computer
| order by AvgMemoryMB asc
Step 6: Alerting Strategies
Metric Alert (CPU Threshold):
az monitor metrics alert create \
  --name "High CPU Alert" \
  --resource-group rg-monitoring \
  --scopes /subscriptions/.../resourceGroups/rg-web/providers/Microsoft.Web/sites/myapi \
  --condition "avg Percentage CPU > 80" \
  --window-size 5m \
  --evaluation-frequency 1m \
  --action /subscriptions/.../actionGroups/ops-team
Expected output:
{ "value": [{ "name": { "value": "Requests" }, "timeseries": [{ "data": [{ "total": 1234 }] }] }] }

Log Alert (Error Rate):
// Alert query
requests
| where timestamp > ago(5m)
| summarize
```text
TotalRequests = count(),
FailedRequests = countif(success == false)```
| extend ErrorRate = (FailedRequests * 100.0) / TotalRequests
| where ErrorRate > 5
az monitor scheduled-query create \
  --name "High Error Rate" \
  --resource-group rg-monitoring \
  --scopes /subscriptions/.../components/myapi-insights \
  --condition "count > 0" \
  --condition-query "requests | where timestamp > ago(5m) | where success == false | count" \
  --window-size 5m \
  --evaluation-frequency 5m \
  --severity 2 \
  --action /subscriptions/.../actionGroups/ops-team
Expected output:
{ "value": [{ "name": { "value": "Requests" }, "timeseries": [{ "data": [{ "total": 1234 }] }] }] }
> **Architecture Overview:** 
{
"properties": {
```text
"lenses": [
{
"parts": [
{
"position": { "x": 0, "y": 0, "colSpan": 6, "rowSpan": 4 },
"metadata": {
"type": "Extension/Microsoft_Azure_Monitoring/PartType/MetricsChartPart",
"settings": {
"content": {
"metrics": [
{
"resourceId": "/subscriptions/.../components/myapi-insights",
"name": "requests/count",
"aggregationType": "Count"
}
],
"title": "Request Rate"
}
}
}
}
]
}
]```
}
}
Workbook for Executive Summary:
// Active users
customEvents
| where timestamp > ago(30d)
| summarize ActiveUsers = dcount(user_Id)

// Request success rate
requests
| where timestamp > ago(30d)
| summarize
```text
TotalRequests = count(),
SuccessfulRequests = countif(success == true)```
| extend SuccessRate = (SuccessfulRequests * 100.0) / TotalRequests
Step 8: Cost Optimization
Sampling Configuration:
builder.Services.Configure<TelemetryConfiguration>(config =>
{
```text
config.DefaultTelemetrySink.TelemetryProcessorChainBuilder
    .UseAdaptiveSampling(maxTelemetryItemsPerSecond: 5)
    .Build();```
});
Data Retention:
az monitor log-analytics workspace update \
  --resource-group rg-monitoring \
  --workspace-name logs-workspace \
  --retention-time 90
Expected output:
{ "value": [{ "name": { "value": "Requests" }, "timeseries": [{ "data": [{ "total": 1234 }] }] }] }

Cap Daily Ingestion:
az monitor app-insights component update \
  --app myapi-insights \
  --resource-group rg-monitoring \
  --cap 5  # GB per day
Expected output:
{ "value": [{ "name": { "value": "Requests" }, "timeseries": [{ "data": [{ "total": 1234 }] }] }] }

Advanced Patterns
Pattern 1: Composite Alerts (Multiple Conditions)
let errorRate = requests
```text
| where timestamp > ago(5m)
| summarize ErrorRate = countif(success == false) * 100.0 / count();```
let highCpu = performanceCounters
```text
| where timestamp > ago(5m)
| where counterName == "% Processor Time"
| summarize AvgCPU = avg(counterValue);```
errorRate
| join kind=inner highCpu on $left.timestamp == $right.timestamp
| where ErrorRate > 5 and AvgCPU > 80
Pattern 2: Proactive Autoscaling
az monitor autoscale create \
  --resource-group rg-web \
  --resource /subscriptions/.../sites/myapi \
  --min-count 2 \
  --max-count 10 \
  --count 2 \
  --scale-out-cooldown 5 \
  --scale-in-cooldown 5

az monitor autoscale rule create \
  --resource-group rg-web \
  --autoscale-name myapi-autoscale \
  --condition "Percentage CPU > 75 avg 5m" \
  --scale out 1
Expected output:
{ "value": [{ "name": { "value": "Requests" }, "timeseries": [{ "data": [{ "total": 1234 }] }] }] }

Pattern 3: Live Metrics Stream
// Enable Live Metrics
builder.Services.AddApplicationInsightsTelemetry(options =>
{
```text
options.EnableQuickPulseMetricStream = true;```
});
Troubleshooting
Issue: No telemetry appearing
Solution: Verify connection string; check firewall rules; ensure SDK version compatibility
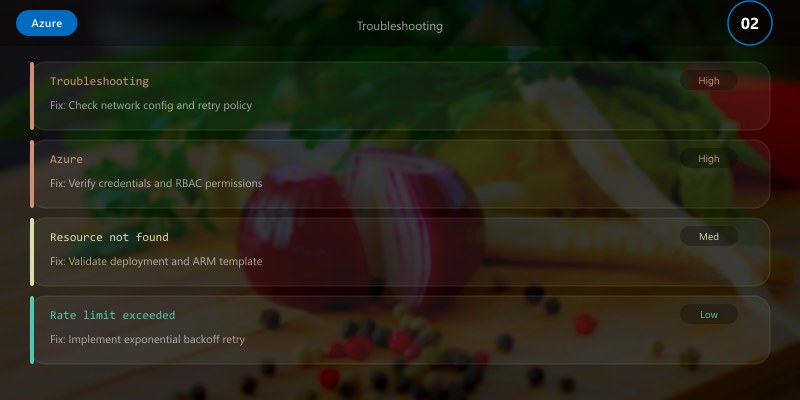
Issue: High ingestion costs
Solution: Enable adaptive sampling; filter noisy telemetry; reduce retention period
Issue: Missing dependency data
Solution: Ensure SQL/HTTP auto-instrumentation enabled; check dependency tracking configuration
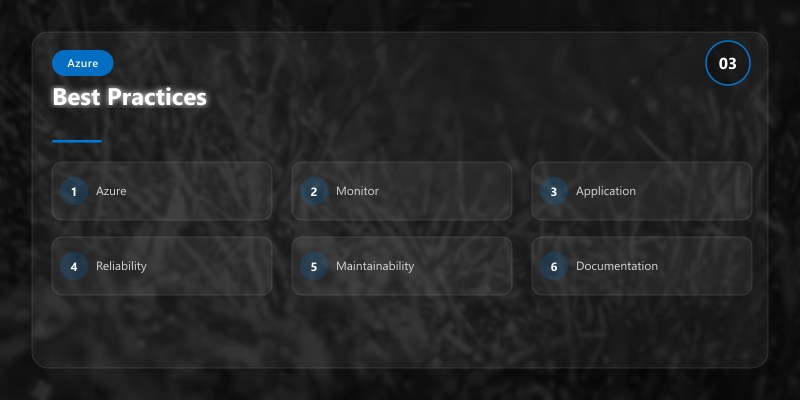
Best Practices
- Use structured logging (ILogger with scopes)
- Implement custom events for business metrics
- Set appropriate sampling rates (5-10 items/sec for most apps)
- Create actionable alerts (avoid alert fatigue)
- Use workbooks for stakeholder reporting
- Regularly review and optimize KQL queries
- Tag resources with environment/owner for filtering
Architecture Decision and Tradeoffs
When designing cloud infrastructure solutions with Azure, consider these key architectural trade-offs:
| Approach | Best For | Tradeoff |
|---|---|---|
| Managed / platform service | Rapid delivery, reduced ops burden | Less customisation, potential vendor lock-in |
| Custom / self-hosted | Full control, advanced tuning | Higher operational overhead and cost |
Recommendation: Start with the managed approach for most workloads and move to custom only when specific requirements demand it.
Validation and Versioning
- Last validated: April 2026
- Validate examples against your tenant, region, and SKU constraints before production rollout.
- Keep module, CLI, and SDK versions pinned in automation pipelines and review quarterly.
Security and Governance Considerations
- Apply least-privilege access using RBAC roles and just-in-time elevation for admin tasks.
- Store secrets in managed secret stores and avoid embedding credentials in scripts or source files.
- Enable audit logging, data protection policies, and periodic access reviews for regulated workloads.
Cost and Performance Notes
- Define budgets and alerts, then monitor usage and cost trends continuously after go-live.
- Baseline performance with synthetic and real-user checks before and after major changes.
- Scale resources with measured thresholds and revisit sizing after usage pattern changes.
Official Microsoft References
- https://learn.microsoft.com/azure/
- https://learn.microsoft.com/azure/architecture/
- https://learn.microsoft.com/azure/well-architected/
Public Examples from Official Sources
- These examples are sourced from official public Microsoft documentation and sample repositories.
- Documentation examples: https://learn.microsoft.com/azure/architecture/
- Sample repositories: https://github.com/Azure-Samples
- Prefer adapting these examples to your tenant, subscriptions, and governance requirements before production use.
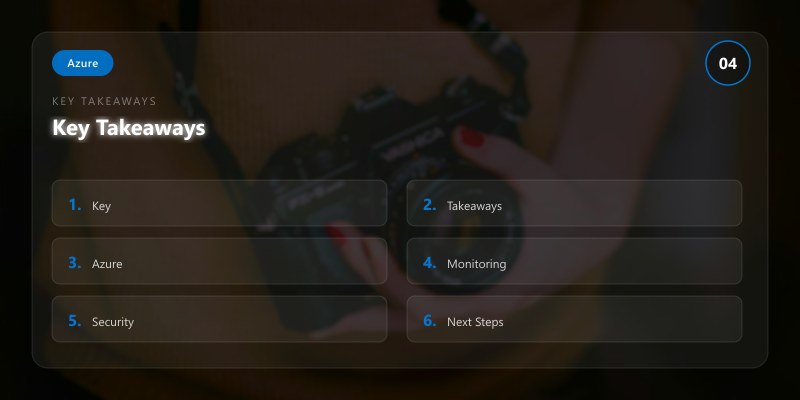
Key Takeaways
- Application Insights provides automatic instrumentation for .NET/Node.js/Java.
- KQL enables powerful log analysis and correlation.
- Smart Detection identifies anomalies without manual configuration.
- Distributed tracing visualizes end-to-end request flows.
Next Steps
- Implement SLA-based alerts with multi-resource queries
- Explore Azure Monitor for containers (AKS insights)
- Integrate with Azure DevOps for deployment tracking
Additional Resources
Is your system observable enough to debug production issues?
```